The Repricing Regime
Introduction
As we celebrate America’s 250th birthday, I was inspired to start some journaling on items of interest to me. If you have read my book, Fed Up!, you will know that I enjoy writing about central banking, liquidity, Soros-style “reflexivity”, and translating what this means for ordinary people. I think it is important to understand the “moral tension in policy decisions", i.e., what prolonged monetary policy distortion actually does to people, incentives, and values.
The Economist has recently done a podcast on Alexis de Tocqueville’s original travels through America. His writings in this period would become Democracy in America. I found it to be great listening. It traces Tocqueville’s journey through America today. Would he still find the characteristics that impressed him so much - the grit, resilience, sense of optimism and opportunity? Would he still find a democracy of opportunity?
Which brings me back to my personal circumstances. Did hard work drive success/prosperity or was I just a beneficiary of policy decisions at a much more macro level. Perhaps the real answer is that the education and work ethic allowed me to be in a position where I had more “convexity” to the policy mix, but it was certainly not me alone.
I acknowledge up front that this is not a Fed quality research paper (upon which they would base policy change). It is also intentionally focused on the ramifications of monetary policy without giving as much consideration to fiscal policy.[1]
But, I do hope that this, along with the adjacent tools that appear on my website, help simplify the complex. To help show the impact of policy decisions on normal people. That is my real goal.
The Repricing Regime
One of the more consequential legacies of the post-Global Financial Crisis (GFC) era: America got richer on paper, but the assets responsible for that wealth moved further out of reach for households that did not already own them. It drove a wedge in wealth inequality.
At the core is a widening gap between income accumulation and inflation. Wages accrue slowly over time (and are hurt much more by periods of high inflation), while asset prices reprice continuously, and often far faster than income can catch up (and can go up faster in a high inflation environment). That gap was visible well before it became a political narrative: it’s the traditional tension between labor and capital - how are the spoils split between the workers and the asset owners.
The policy mix ends up having a huge impact on this distribution. Since the 80s, and certainly since the GFC, the trends suggest that the benefits flow disproportionately through ownership due to the Fed’s adopted policy mix – accommodative monetary policy (meaning lower interest rates), a willingness to tolerate higher inflation rates, and continuously operating with a large balance sheet (either outright quantitative easing [QE] or continuously providing liquidity to the markets which impacts risk tolerance).
Over the past two decades, easier financial conditions lifted the value of assets that were already unevenly distributed, strengthening the position of owners while leaving wage-reliant households disadvantaged relative to the assets moving around them. Keynes expected low interest rates to euthanize the rentier; in practice, the post-GFC regime (and introduction of QE as a policy tool) often did more to penalize the cash saver than to diminish the rentier’s advantage.
Three observations are important: first, post-GFC household sector wealth gains were driven heavily by the repricing of existing assets; second, those assets were highly concentrated before the repricing occurred; and third, asset prices are sensitive to monetary conditions, particularly discount rates and liquidity (which helps to drive risk appetite and speculative behavior).
The first question is straightforward: what assets actually moved?
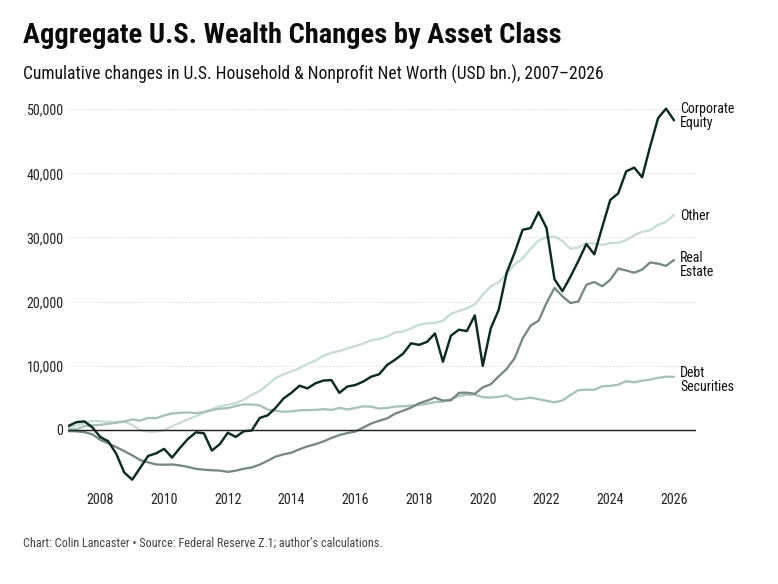
From 2007 through Q1 2026, U.S. household and nonprofit sector net worth rose by $114.7tn, but the drivers behind that increase are more revealing than the number itself. Corporate equities contributed $48.3tn, while real estate added another $26.5tn; together, those two categories accounted for roughly two-thirds of the sector’s nominal wealth gain. The first implication is that the post-GFC wealth expansion is concentrated in assets whose benefits are mediated through ownership rather than labor income. Equities are claims on corporate earnings capitalized by public markets; housing is both a consumption good and a leveraged claim on land scarcity, credit availability, and local income expectations. In both cases, the relevant transmission channel is not labor income but asset ownership.

Moreover, viewed in composition rather than in aggregate, the post-2007 rise in household sector wealth appears substantially less like a story of fresh accumulation and more like one of balance sheet repricing. Of the $114.6tn increase in household net worth over 2007–2025, roughly $79.1tn, or about 69%, came from net holding gains, compared with $32.2tn from net new investment. Put differently, the household sector recorded far more wealth through the rising market value of existing ownership than through new net addition.
The two mechanisms distribute gains very differently. If wealth gains are produced through new investment, their distribution can, at least in principle, shift with wages, participation, and behavior; if they are primarily produced through gains on existing holdings, their distribution is largely pre-loaded by the ownership that existed before the repricing began. Once revaluation (driving asset prices higher) becomes the dominant source of wealth movement, the relevant divide is not merely between savers and non-savers, but between incumbent owners of the assets being repriced and those still trying to accumulate them afterwards.
The second question, then, is not whether households “owned assets” in some generic way, but whether they carried enough exposure for the repricing to matter. The same rally that raises retirement balances, also raises the hurdle rate for non-owners: the deposit saver is protected from mark-to-market losses but excluded from multiple expansion; the renter has to pay the new clearing price for shelter; the young household may participate through a retirement account, but usually at a position size too small to offset the rising cost of entry into housing and financial assets - participation is not the real threshold that matters.

On that measure, asset distribution is highly asymmetric. By Q1 2026, the top 10% owned roughly 87.4% of corporate equities and mutual fund shares, while the bottom half owned about 1.1%. The single largest contributor to the post-2007 increase in household net worth is also the asset class whose ownership is most concentrated.

It is true that stock-market participation broadened: the share of households with stock holdings, indirect holdings included, rose from 53.2% in 2007 to 58% in 2022. But the median household with stock holdings owned only about $52,000, compared with a mean of roughly $492,000. On the other hand, between 2019 and 2022, the share of families directly owning stocks rose from 15.2% to 21%; yet the median direct stock position fell from $29,000 to $15,000, while the mean position remained essentially unchanged at roughly $404,000. By 2022, the mean direct stock position was almost 27x the median, up from roughly 14x in 2019, which means that the expansion in participation did not materially alter the distribution of gains.
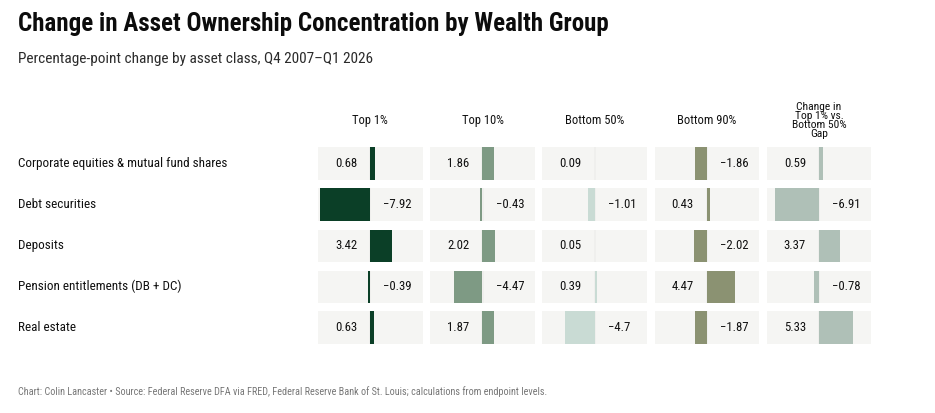
Real estate is the politically charged case because it is the asset American households most intuitively associate with middle-class wealth. Unlike equities, housing is not owned almost entirely by the top 10%; it is more broadly owned, and more embedded in household identity. Yet change in asset ownership shows that from Q4 2007 to Q1 2026, the bottom half share of real estate declined by 4.7pp, while the top 10%’s share rose by 1.9pp, and the gap between the top 1% vs. the bottom half widened by 5.3pp. The bottom half’s claim on aggregate real estate value shrank (as prices moved higher). This obviously creates a large problem - higher entry prices for non-owners.
Pensions are more broadly held than equities, and the change in ownership since 2007 appears more favorable to the bottom 90% than the shifts in equities or real estate. But a pension claim is different: it is deferred, institutionally mediated, and not easily converted. It gives households participation in capital market returns, but not the same agency that comes with directly owned financial assets or home equity.
In an asset repricing-led wealth cycle, ownership concentration does not need to worsen materially for the dollar gap to widen; stable ownership shares applied to a much larger asset base are enough to produce a substantially more unequal distribution of gains.
Prior commentators on these topics such as Hirschman and Rothschild have argued that the tunnel effect depends on the expectation that movement elsewhere can still be a signal of one’s own eventual progress. Inequality can be tolerated when the movement of another lane is interpreted as evidence that one’s own lane may soon move, but the same movement becomes corrosive when the route to catch-up appears closed. In this case, the moving lane is ownership itself. Incumbent owners captured the repricing through equity gains, higher collateral values, and market beta; renters, younger buyers, and non-asset-owners faced the same move not as a windfall, but as a higher hurdle.
The third question is how assets respond to the monetary environment. Monetary policy does not need to be the only driver of asset appreciation for it to matter distributionally, it only needs to transmit through various channels such as discount rates, term premia, liquidity, risk appetite, and mortgage credit in an economy where the most policy-sensitive assets are already unevenly owned.
The discount rate (asset-pricing) channel is the first layer. When the Fed lowers the policy-rate path, the effect is not confined to overnight money, it generally propagates into longer-term interest rates and pulls down the risk-free “curve,” which is why monetary policy can affect asset prices without directly purchasing the assets themselves. For long-duration assets, the present value of future cash flows is highly sensitive to the rate at which those cash flows are discounted. Equities, venture-like growth claims, real estate, and long bonds share a common sensitivity to the discount rate regime.

The largest household sector net worth revaluation came in 2021, when net holding gains reached roughly $18.8tn and both policy rates and real yields were near the floor. The only large post-GFC revaluation loss came in 2022, when interest rates moved higher (and equity prices lower) due to the higher inflation shock. That being said, by 2025, revaluation had turned strongly positive again despite much higher nominal and real rates.

The second layer is the portfolio-balance channel, which is a more useful way to discuss QE without making it sound mystical. The Fed’s asset purchases don’t mechanically “create” household wealth, but they changed the private sector’s available menu of assets and returns. When the central bank removes duration, convexity and replaces longer-duration securities with reserves, investors must hold a different mix of assets at prevailing prices; because those assets are not perfect substitutes, the market clears through lower term premia, lower required returns on safer assets, and a greater willingness to move outward along the risk curve. This is the Tobin-style portfolio balance intuition in its modern form: policy can affect the relative price of assets even without buying equities, because the price of one claim is set against the price and scarcity of the rest of the portfolio options. The chart above shows that during the same period in which household assets were repeatedly remarked higher, the Fed became a much larger marginal holder of duration and safe assets. Even though QE doesn’t map one-for-one into household wealth, it has helped compress the returns available on safe assets and pushed the private sector towards riskier (higher return) assets.
The third layer is the risk premium channel. For risky assets, monetary policy often matters less because it changes next quarter’s cash flow and more because it changes the discount applied to uncertain cash flows. Bernanke and Kuttner’s event-study evidence separates the equity market response to unexpected policy moves from ordinary macro noise: they found that a surprise 25bp rate cut was associated with roughly a 1% increase in broad stock indexes, with much of the response traced to expected excess returns rather than near-term dividend expectations. Policy affects the price of risk, not just the price of money.
Easing and tightening are not mirror images once asset prices have already been capitalized into household balance sheets. Lower rates can lift multiples, collateral values, and risk-taking capacity for incumbent owners; later rate hikes may compress valuations at the margin, but they do not automatically redistribute the gains already booked, reverse refinancing advantages, or restore the entry price for households that missed the earlier repricing.
The strongest counterargument does deserve a nod: accommodative policy also works through employment - it can support jobs and wage growth. Still, whatever easing does for paychecks, its balance-sheet effects disproportionately benefit the holders of the assets.
All things considered, monetary policy is highly relevant. It does not determine the ownership map, nor does it single-handedly produce asset-price gains; but it does operate through the very channels that convert macro conditions into market valuations: discount rates, term premia, liquidity, and risk premia. In an economy where the largest repriced assets are already unevenly owned, that amplifies further inequality. The policy intention may be broad, but the true winners seem to be a smaller subset. When monetary policy transmits through asset ownership structure, ownership itself ultimately becomes the gatekeeper.
In concluding for now, America has historically shown a certain tolerance or acceptance for wealth inequality. Maybe it is part of the American Dream… But, like everything, there are limits on what people will tolerate. And maybe policy is in the early innings of a shift. The credibility of the Fed under new Chair Warsh is now becoming a tradeable theme. It is visible in market pricing…in the shape of the yield curve, the behavior of the dollar, and in the repricing of front-end interest rates.
Perhaps we are on the cusp of a shifting reaction function: inflation misses are no longer going to be accommodated. For most of the post GFC period, policy was still interpreted through the lens of insurance…if growth weakened, the Fed would ease…if risk assets wobbled, the Fed would ease…and if inflation came from supply side or energy, officials would look through it. The Warsh Fed is signaling something different…Perhaps we are moving away from a world of ultra-loose monetary. Let’s see if real change is afoot and what this means for the “rules of the game” and the distribution of wealth…
[1] Or, for that matter, on the policy of intentional debasement. One can argue that Fed Chairman Bernanke made this public in 2012. Strangely, it was deemed consistent with the central bank’s mandate to promote “stable prices.” But, a 2% rate of inflation (or much greater as we have experienced over the past 5 years) translates into a nearly 80% decline in the dollar’s purchasing power over the average lifespan of an American…. That certainly hurts workers much more than owners.
*This note is for informational and educational purposes only and does not constitute investment, financial, legal, tax, or other professional advice, nor an offer or solicitation to buy or sell any security. Views are the author's own as of the date of writing and are subject to change.